Distributions look at the “shape” of our data. How likely is each value to occur? Is there a central tendency? Distributions can be analyzed mathematically, but a simple way of getting a feel for the type of data we have is to graph it on a histogram. A histogram splits the data up into categories and then asks how many fall into each category (the frequency of that category). Below are a few common types of distributions linked to example histograms.
Uniform:
If all possible measurement values are equally likely we have a uniform distribution. Rolling a single die would produce a uniform distribution since every number (1-6) is equally likely to occur.
The graph below (Fig. 1) illustrates a uniform distribution, with possible values of the measurement ranging from 1-6. Notice that all the bars are about the same height because all values are equally likely. The differences in height among the bars represents only random variation.
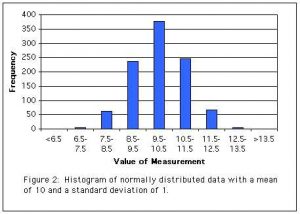
Normal:
A normal distribution is the famous “bell curve.” In a normal distribution, values near the mean are most common and values further from the mean becoming increasingly unlikely (one of the things that makes a normal distribution so useful is that we know how unlikely a value is for a given distance from the mean). Normal distributions are symmetrical, meaning that measurements on either side of the mean are equally likely, only the distance from the mean matters. Many biological measurements fall approximately into a normal distribution, and many inferential statistics assume normality, making the normal distribution a valuable tool for biologists.
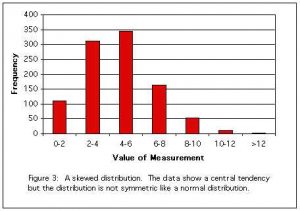
Skewed:
Some distributions have a central tendency but are not symmetrical. These are said to be skewed. Some inferential statistics cannot be applied to seriously skewed data. See here for details.