Central Tendency
In many data sets, the majority of the values will tend to fall near the middle of the range (they tend to be near the centre). If you measured the height of 100 male university students, for example, you’d probably find a few individuals that were five feet tall or less, and a few that were close to seven feet tall, but the majority would be a bit under six feet tall. Several different statistics are commonly used to measure this central tendency. All have the same units as the original measurements.
Mean:
The arithmetic mean is the formal name for what we commonly call the average. (Use mean rather than average, however, because average is also sometimes used to describe the other measures of central tendency.) The mean is calculated as the sum of the values divided by the number of values. So the mean of {5, 6, 12} is (5+6+12)/3= 7.7. The mean is most useful when the data falls into a symmetrical distribution such as a normal curve.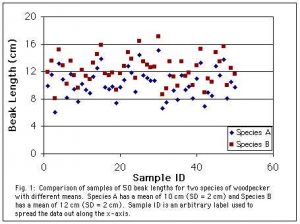
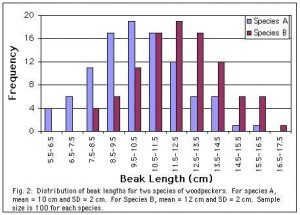
The graphs below compare two samples (sets of measurements) of beak length from populations (in this case species) with different means. Both species show considerable variation, but Species B tends to be larger. (Data were invented.)
Median:
If you rank your from lowest to highest (or vice versa) the median will be the data point in the middle. The median of {3,6, 12, 14, 15} is 12 since it is in the middle ranking (third of five numbers). If you have an even number of data points, the median will be the mean of the two points closest to the middle ranking. So for {3, 6, 12, 14, 15, 35} the median would be the mean of 12 and 14 or 13. Notice that the median ignores the size of the difference between values, and only looks at the rankings (it converts the measurements from ratio or interval to ordinal). This is useful if the measurements are skewed by a few very large or very small measurements. A single measurement can have a huge effect on the mean if it is far from other measurements, but will have a much smaller impact on the median, since we only look at its rank, not its actual position. However, by using only the rankings, we are throwing away some information about our measurements, which may give us less power to see patterns.
Mode:
The mode is the most commonly occurring value in a set of measurements. For example the mode of {2,3,5,5,6,6,6,7,8,8,10} is six since it occurs three times, more than any other value. The mode is not a commonly used statistic, but can be useful in a distribution with more than one central tendency (called a bimodal distribution).