Although most data have a central tendency, there are still typically some differences from measurement to measurement, either as a result of sampling error, or, more importantly, due to natural variation in what we are measuring. For example, if we were measuring the number of head hairs in humans, we will see a huge amount of variation, from a few hundred, to many thousand. If we measured number of fingers we would see a much smaller amount of varation (a few people have four or six fingers), and if we measured number of eyes, we would see essentially no variation at all. Knowing the amount of variation associated with a set of measurements is just as important as knowing the central tendency. Any measure of mean or median should be accompanied by an estimate of variation.
Range:
The range is the difference between the highest and lowest measurements. It is the simplest measurement of variation, but not as useful as the others because it takes no account of how many measurements fell near the centre, and how many were close to the extremes.
Variance:
Variance (s2) can be estimated using two formulae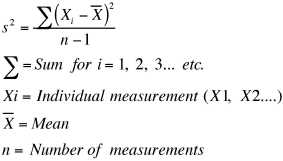 (Zar 1996): The first is easier to understand. We first take the distance each point lies from the mean. We square these distances since otherwise distances below the mean would cancel out distances above the mean. We add all these squared distances up, and then divide by n-1, where n is the number of measurements. So the formula is similar to an average, but it’s the average of the distances from the mean (squared). Because we are squaring our distances, the units of variance are the units of the original measurements squared. You may also see a formula for variance which uses n instead of n-1. This is the equation for variance of a population. The formula given here is the formula for variance of a sample. If you counted every trout in a lake and wanted to know the exact variance of the population, you would use the formula with n. If you sampled 25 fish from the lake and wanted to estimate the variance, you would use the formula given here.
The second formula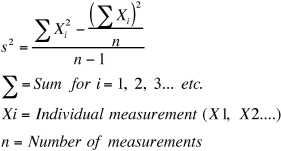 is less intuitive, but much easier to calculate if you have a large set of measurements. It gives exactly the same answer as the first formula. (Try it for yourself and see!)
Standard Deviation:
Standard deviation (s or SD)is the square root of variance. Taking the square root brings us back to the original units of our measurement. Standard deviation is especially useful if the measurements are distributed in a normal curve (see Distributions). In a normal distibution, about 68.3% of the population will lie within one standard deviation above or below the mean, 95.4% will be within two standard deviations of the mean, and 99.7% within three standard deviations. Like variance, standard deviation can be calculated for an entire population (formula with n) or for a sample (formula with n-1).
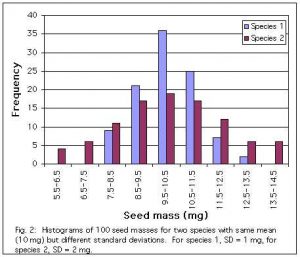
The graphs below compare samples of seed mass from two populations with the same mean but different standard deviations. Data were invented.
Coefficient of Variation:
The coefficient of variation provides a way of comparing the amount of variability in two samples with very different means, by calculating standard deviation as a percentage of the mean. Coefficient of variation (V or CV) is calculated as standard deviation divided by mean, times 100.
Standard Error:
Standard error (SE or SEM) is actually a measure of variation in our estimate of the mean. Since our mean is calculated from a sample, it has error associated with it. It might be a bit too high or a bit too low. Knowing how large this error is tells us how much confidence to have in our estimate of the mean. Another way to think about standard error is to imagine that we sample our population many times (each sample consisting of many individual measurements). We would get a slightly different estimate of the mean each time, and we can estimate the standard deviation of these values. We don’t actually need to collect many different samples to calculate standard error, it can be estimated from a single sample. Standard error is estimated as the standard deviation divided by the square root of sample size.