I teach physical chemistry at the University of Lethbridge. I even wrote a textbook that we use in my class. The course includes a module on chemical kinetics, but as I explain to the students, kinetics shows up in a lot of places. With the Covid-19 pandemic being top of mind for everyone this year, and given that it’s a fairly straightforward extension to material I already teach in this class, I decided to teach the students how to compute those R numbers we keep hearing about in the news. The calculation is fairly easy (if you know a bit of kinetics), so as a public service, I’m going to be calculating weekly R numbers for Lethbridge and posting them here.
The R number is an estimate of how many new infections we are seeing for each infected individual, on average. Thus, an R number above 1 means that the number of infections is growing. An R number below 1 means that the number of infections is shrinking. Of course, we can just look at the daily case counts to get this information, but R gives you one simple number to look at, and moreover the calculation method has the effect of smoothing out the day-to-day fluctuations in case counts.
The method I initially used to calculate R was crude. The method had one free parameter, namely the average period of time than an individual is infectious. This parameter has considerable uncertainty, and it depends on behavior. For example, a person no longer counts as “infectious” if they are self-isolating. In order to estimate this parameter, I used provincial values for the number of active cases along with the province’s estimate of R to calculate an effective infectious period for each week from March 15 to April 30, inclusive. The mean infectious period calculated from these data was 3.8±2.3 days. To my surprise, this value is very low compared to the biological infectious period of about two weeks. But there it is. The low value suggests that most people are doing the right thing and staying away from other people when they think they might be infected.
Eventually, I decided to use an SIR model to calculate R. This has the advantage that I don’t need to use the provincial data to calibrate any of the parameters. It has the disadvantage that a realistic model for Covid-19 is much more complicated than the simple SIR model would have it, so there is some amount of what we call “modelling error” in the estimate. R values starting the week of May 3 were calculated from an SIR model.
One more brief note on SIR models: the R variable in an SIR model doesn’t distinguish between different ways of exiting the I class. Thus, R = recovered + dead. Because relatively few people die from Covid-19, the difference isn’t large, but it’s probably not insignificant.
Note that I will not be providing confidence intervals, which I feel would give an undeserved air of statistical certainty to these calculations. Finally note that these calculations are retrospective. They do not necessarily predict what will happen next week.
I will be updating this table on a weekly basis. I’m using the data published daily in the Lethbridge Herald, for a few of reasons, one of which is that it’s convenient, and the other being that it’s about the right amount of data to get a decent estimate of R. Because of the Herald’s publishing schedule, this also leaves out weekend data which are often off-trend and might cause some statistical difficulties otherwise. (In principle, leaving out the weekend data shouldn’t affect the R value, which is based on how fast case counts are growing, and not on exactly when we started counting or how long a stretch of data we use. As an analogy, think about your speed as you go down the highway, which you can get by dividing distance by time. As long as you keep a constant speed, it doesn’t matter exactly when you start or stop measuring time and distance travelled. However, if you wanted to calculate a typical speed of travel, you wouldn’t include a period of time when you took your foot off the gas. Similarly, lower testing rates over the weekends would result in data that I would have to throw out because they are off the weekly trend line. The Monday “catch up” data point sometimes has to be discarded because it is off the trend line in the other direction.)
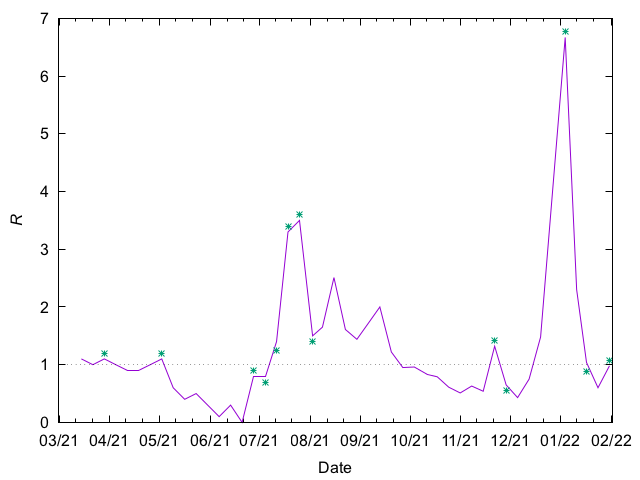
I would finally note that R values calculated from January 2022 onward are somewhat suspect because of the restriction of testing to select groups as the omicron wave overwhelmed the Province’s testing capacity.
Hopefully some of you will find these local R values useful.