Category Archives: Scientific issues of public concern

Lethbridge’s Covid-19 R number

I teach physical chemistry at the University of Lethbridge. I even wrote a textbook that we use in my class. The course includes a module on chemical kinetics, but as I explain to the students, kinetics shows up in a lot of places. With the Covid-19 pandemic being top of mind for everyone this year, and given that it’s a fairly straightforward extension to material I already teach in this class, I decided to teach the students how to compute those R numbers we keep hearing about in the news. The calculation is fairly easy (if you know a bit of kinetics), so as a public service, I’m going to be calculating weekly R numbers for Lethbridge and posting them here.

The R number is an estimate of how many new infections we are seeing for each infected individual, on average. Thus, an R number above 1 means that the number of infections is growing. An R number below 1 means that the number of infections is shrinking. Of course, we can just look at the daily case counts to get this information, but R gives you one simple number to look at, and moreover the calculation method has the effect of smoothing out the day-to-day fluctuations in case counts.

The method I initially used to calculate R was crude. The method had one free parameter, namely the average period of time than an individual is infectious. This parameter has considerable uncertainty, and it depends on behavior. For example, a person no longer counts as “infectious” if they are self-isolating. In order to estimate this parameter, I used provincial values for the number of active cases along with the province’s estimate of R to calculate an effective infectious period for each week from March 15 to April 30, inclusive. The mean infectious period calculated from these data was 3.8±2.3 days. To my surprise, this value is very low compared to the biological infectious period of about two weeks. But there it is. The low value suggests that most people are doing the right thing and staying away from other people when they think they might be infected.

Eventually, I decided to use an SIR model to calculate R. This has the advantage that I don’t need to use the provincial data to calibrate any of the parameters. It has the disadvantage that a realistic model for Covid-19 is much more complicated than the simple SIR model would have it, so there is some amount of what we call “modelling error” in the estimate. R values starting the week of May 3 were calculated from an SIR model.

One more brief note on SIR models: the R variable in an SIR model doesn’t distinguish between different ways of exiting the I class. Thus, R = recovered + dead. Because relatively few people die from Covid-19, the difference isn’t large, but it’s probably not insignificant.

Note that I will not be providing confidence intervals, which I feel would give an undeserved air of statistical certainty to these calculations. Finally note that these calculations are retrospective. They do not necessarily predict what will happen next week.

I will be updating this table on a weekly basis. I’m using the data published daily in the Lethbridge Herald, for a few of reasons, one of which is that it’s convenient, and the other being that it’s about the right amount of data to get a decent estimate of R. Because of the Herald’s publishing schedule, this also leaves out weekend data which are often off-trend and might cause some statistical difficulties otherwise. (In principle, leaving out the weekend data shouldn’t affect the R value, which is based on how fast case counts are growing, and not on exactly when we started counting or how long a stretch of data we use. As an analogy, think about your speed as you go down the highway, which you can get by dividing distance by time. As long as you keep a constant speed, it doesn’t matter exactly when you start or stop measuring time and distance travelled. However, if you wanted to calculate a typical speed of travel, you wouldn’t include a period of time when you took your foot off the gas. Similarly, lower testing rates over the weekends would result in data that I would have to throw out because they are off the weekly trend line. The Monday “catch up” data point sometimes has to be discarded because it is off the trend line in the other direction.)

I would finally note that R values calculated from January 2022 onward are somewhat suspect because of the restriction of testing to select groups as the omicron wave overwhelmed the Province’s testing capacity.

Hopefully some of you will find these local R values useful.
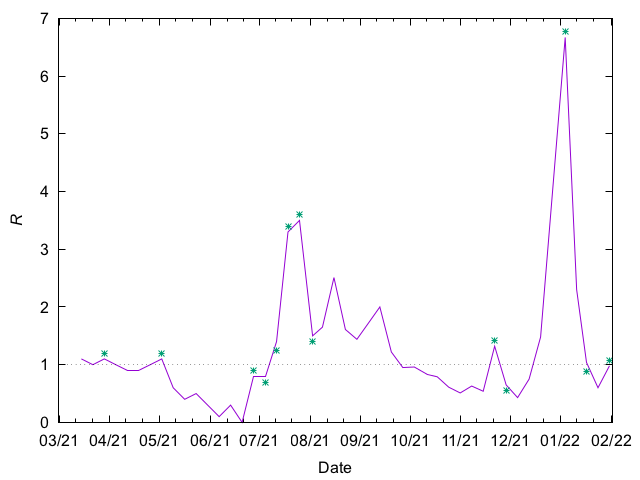
R values for Lethbridge (2021). Asterixes indicate points with larger uncertainties, sometimes due to statutory holidays reducing the number of available data points for the week, and sometimes to unusual scatter or other data anomalies.

Climate change mitigation measured in gas tanks

A lot of the discussion around what we need to do to slow down climate change is described to us in tonnes of CO2. The trouble is of course that most of us don’t know what a tonne of CO2 looks like. I thought I would try to bring this discussion into terms that most of us would understand by rephrasing it in terms of gas tanks. Keeping in mind that not all carbon emissions come from burning gasoline in a car, a gas tank is still probably a more useful visualization for most of us than a tonne of CO2. Note also that what we really care about is the total warming potential of all greenhouse gases released into the atmosphere, which is usually measured in CO2 equivalents. But since the basic unit of measure is still a tonne of CO2, the discussion below is framed in terms of CO2.

First of course we have to decide how big a tank we’re going to use. Because there’s a precedent for using a 50 L tank, that’s what I’m going to use as my standard tank. That’s the size of tank you have in a typical smaller car. At 2.3 kg of CO2 per liter of gasoline, a 50 L tank will produce 115 kg of CO2 when burned in your automobile engine. Conversely, a tonne of CO2 would be equivalent to about 8.7 tanks.

To meet its Paris accord commitments, Canada needs to cut its emissions by about 205 million tonnes of CO2 between now and 2030. (Some of you will say, “but our Paris commitments aren’t enough!” You’re right, of course, but it’s a baseline to aspire to in the short run.) As I write this, the population of Canada is about 37.6 million, so that’s 5.5 tonnes per Canadian per year. That’s about 48 gas tanks per person per year. Note that this figure includes CO2 emissions from industry and from private use, but keep in mind too that this does not include all of the carbon emissions you are responsible for through your purchases of foreign-made goods, which are accounted for in the country where these emissions are produced. So, for example, if you buy a pair of shoes made in Vietnam, those are Vietnam’s emissions, even though you are the person driving these emissions. StatsCan tried to estimate household contributions to greenhouse gas emissions (not including foreign emissions for goods imported into and consumed in Canada) a bit over a decade ago, and found that households were responsible for about 46% of Canada’s greenhouse gas emissions, either directly or indirectly. Assuming a similar ratio still holds, each of us is on the hook for about 22 gas tanks per year.

I don’t know about you, but I don’t think I fill up my gas tank 22 times per year. Remember: those are 50 L tankfuls. A lot of the times I “fill” my tank, I’m only buying 30 or 40 L of fuel. So I could stop driving completely, and that wouldn’t do it, especially when you consider that I live in a three-person household with just one car, so I can’t count on my wife and son to cut 22 fill-ups of cars they don’t have! The idea here isn’t to think in terms of literal gas tanks, but in terms of gas-tank equivalents. Between the three of us, my wife, son and myself need to cut about 66 gas-tank equivalents out of the emissions we’re responsible for.

There are plenty of web sites that will tell you what you can do to reduce your personal carbon emissions. Clearly, if I can drive less and use my bike or public transit more, that helps. Equally clearly, that alone won’t get us there. One of the things that will make a big difference that politicians don’t like to talk about is that we’re probably all going to have to just buy less stuff. I’m going to pull a few figures from Mike Berners-Lee’s excellent book How Bad Are Bananas? to make this point.

Let’s say that building the car you want to buy will produce 15 tonnes of CO2, about what it takes to build a midsize car. That’s 130 gas tanks. You could of course avoid causing those emissions by buying a used car, which won’t cause any extra emissions. But of course, eventually someone has to buy a new car (assuming we don’t all start riding public transit, but that only works for urban dwellers), and let’s suppose that you decide that you really want a new car. You could just buy a smaller car. Some cars have an emissions impact of as little as 6 tonnes of CO2, or 52 gas tanks. Even if you don’t go to the smallest car available, you could easily shave 30 or 40 gas tanks from your emissions just by buying a smaller car.

But wait! Those emissions should be amortized over the time you own the car, right? The average Canadian owns a new car for about 6 years before trading it in. So the impact of your 130-tank car over your period of ownership is about 22 gas tanks per year. Coincidentally, this is how much you need to cut out of your annual emissions, so if you can go car-free, you’ve pretty much done your part (but you might have to find other reductions if a family is sharing a car, as in our case). Going to a smaller car might save 7 gas tanks per year, which is about a third of the 22 tanks per year you need to cut out of your lifestyle. Not bad! But what if you really want that 130-tank car? If you keep it an extra two years, the impact of your new car becomes about 16 tanks per year, so you are reducing your carbon emissions by about the same amount as you would by buying a smaller car, just by keeping your car a bit longer. And obviously, this emissions reduction strategy just gets better the longer you keep the car.

And what about those Vietnamese shoes I mentioned earlier? Making the average pair of shoes and transporting it to a store near you results emissions of about 11.5 kg of CO2, or about a tenth of a tank of gas. I probably buy two to three pairs of shoes per year, so for me, this isn’t worth thinking about. But if you’re a shopaholic who loves shoes, well, I’ll let you do your own calculation…

I suspect that if you’re going to buy clothes, shoes and accessories and are actually going to wear them until they’re ready for disposal, there probably aren’t significant emissions savings to be made by changing your shopping habits. However, some of us, and you know who you are, do buy stuff we won’t wear much before putting it into the basement. Then those fractions of a gas tank really start to add up. As a general rule, buy less, and buy used if you want to cut your carbon footprint. This applies not only to clothes, but to anything else we buy on a whim and then barely use.

And the general idea of buying what you need and using it applies to food, too. Food waste is a massive contributor to greenhouse gas emissions: Because food is wasted, it is necessary to overproduce food, which leads to deforestation, i.e. loss of an important carbon sink. Moreover, agriculture has a direct energy cost, so more food grown means more emissions from the agriculture sector. Then there is the transport of food that will never be eaten. And rotting food often produces methane, an even more potent greenhouse gas than carbon dioxide. A rough estimate is that household food waste (as opposed to food that is wasted somewhere in the supply chain) amounts to about a quarter tonne of CO2 per person per year in Canada, or 2.2 gas tanks. Not a huge number, but still about 10% of the emissions you need to cut per year. Roughly speaking, to reduce the amount of food you waste, you have to buy things you plan to eat, and make sure you actually do use it before it goes bad. Sounds simple, but it does take a bit of a mental adjustment to our shopping and cooking habits.

So there you have it. Climate footprint and emissions reductions conceptualized in gas-tank equivalents. Hopefully this helps you understand the size of the problem a bit better, and also puts in perspective some of the things you can do to reduce your climate impact. A lot of the advice comes down to buying less stuff and using it for longer (or using it at all in the case of food). And as an added bonus, if you spend less, you’ll have more money in your bank account for a rainy day. Win-win.

Sharing data: a step forward

You would think that scientists would be eager to share data. After all, the myth of science that is taught to students is that we build on each other’s work, so of course if we have an interesting data set, we will let anyone have it who wants it, right?

It turns out that the truth is somewhat other than we would like it to be. There are both bad and worse reasons why data is not routinely shared. Probably the worst reason of all is wanting to sit on the data so that one extracts the maximum benefit from the data set while shutting out others. A variation on this theme is only allowing people access to your data if they will agree to make you a coauthor. I once collaborated with a scientist who wanted to use a crystal structure obtained by another lab. (I will leave the names out of it since they’re not relevant.) This was in the mid-1990s when the requirement to deposit structures with the Protein Data Bank (PDB) prior to publication was not yet universal. She was told by her colleagues (and I use the word loosely here) that she could only have their coordinate files if she agreed to include them as coauthors on any paper in which those coordinates were used for the following five years. My colleague and I were astonished by this. Beyond providing coordinates from an already-published structure, they would have made no intellectual contribution to her work, and yet they wanted to be treated as coauthors for an extended period of time. This is no longer possible with protein structures due to the now-universal requirement to deposit structures at the PDB as a condition of publication, but clearly people who hold data sometimes feel this gives them power they can use to further their careers. This is just wrong.

A not-so-good reason for not sharing data is that doing so takes time. A data set that may be perfectly OK for your use may not be suitable for sharing as is. I won’t get into issues of confidentiality with human subjects because I’m not an expert in this area, but clearly anonymizing medical data prior to sharing is important, and then there’s the tricky issue of consent: If the participants in a study did not explicitly agree to have their data used in other studies, is it OK to share the data set with others, even with suitable safeguards in place to protect the privacy of the study participants? Even for data not involving human subjects, sharing data takes time because you have to make sure you provide enough information about the data set for users to be able to make sense of it. This includes (obviously) a full description of what the various data fields represent, but also the conditions under which the data were obtained, any post-processing of the data, etc. Many scientists opt to just keep their data to themselves rather than generating all the necessary metadata. This situation is made worse by the fact that one gets very little credit for putting together a usable data set: It doesn’t count as a publication, so it won’t help a student land a scholarship, tenure and promotion committees are unlikely to give a data set much weight in their deliberations, and granting agencies won’t give you a grant solely because you generate high-quality reusable data.

A significant step forward has been taken with the launch of a new online journal by the Nature Publishing Group entitled Scientific Data. (Incidentally, I learned about this new journal from an article in The Scientist.) This journal is dedicated to the publication of data sets with proper metadata so that they can be used widely. Hopefully, the clout of the Nature Publishing Group will make the various bodies that make decisions about what scientific activities are valued pay attention, and will lead to an increase in the sharing of data sets.

In case you’re wondering whether I put my money where my mouth is: My web site includes a small section of data sets that I have generated that others might find of interest. Could I do more? Sure. Making it worth my while to do so via a journal like Scientific Data might be just the push I need.

Don’t be stupid: get vaccinated

There’s a lot of stuff in the media about vaccines right now, particularly here in Southern Alberta where we’re going through a measles epidemic because we have an unusual number of people in our region who don’t get vaccinated. It’s also flu shot time.

Look, it’s simple: Getting vaccinated protects you from getting sick. It also protects people around you from getting sick because, once you have been vaccinated, you can’t participate in spreading the disease around. Vaccines are among the safest and most effective methods we have for fighting illness. I know a lot of people think that measles and the flu aren’t serious diseases, but they are. The mortality rate from measles in the developed world is between 1 and 3 per 1000 cases. I don’t know about you, but I definitely would not want to bet my life against those odds, particularly when the alternative, the vaccine, involves little more than a little inconvenience. Flu mortality varies wildly with age and strain, but it’s a serious risk, too. And of course there are lots of complications that are less dramatic than death, but still very serious. Similar comments could be made about any of the diseases for which we get vaccinated.

But, you say, what about the risk of vaccine side-effects? If you’re allergic to some of the vaccine ingredients (which include things like eggs), then of course you might have a reaction. The people who administer vaccines know about these things, they ask about them, and then they make sure you stay around for a while after getting the vaccine, just in case. In some cases, they can provide an alternative formulation that excludes a particular allergen. Most of the other side-effects of vaccines are mild (muscle soreness, low-grade fever), and much less disruptive of your daily activities than the diseases they protect you against. The sensational side-effects you hear about from time to time are mostly urban legends. The health care provider administering the vaccine ought to be able to tell you about any realistic side-effects if you’re concerned.

There’s a nice Ph.D. Comics video about vaccination that has just been posted. (Ph.D. Comics does some serious stuff, and they’re really good at explaining things in language we can all understand, regardless of education.) If you need further convincing, watch it, and get vaccinated.

Canada-Wide Science Fair

This week, the Canada-Wide Science Fair (CWSF) was held in Lethbridge, and I had the very good fortune to be asked to serve as Deputy Chief Judge. It was what you might call “fun work”. A lot of late nights, but a huge reward at the end when it became clear that we had run a smooth event and that everyone, judges and finalists alike, were leaving the judging floor happy. A lot of the credit for that has to go to the long-term CWSF organizers, a group of veteran judges who call themselves the CWSF Judging Advisory Panel. These folks really know how to run a large-scale Science Fair!

Other people did most of the media work, but I was asked to do one interview today by the local CTV station. Here is the news item that resulted from that interview:

http://www.youtube.com/watch?v=JsJM79LXCuw&feature=youtu.be

The Pope is a chemist!

As I was listening to a Jesuit priest comment on the election of Pope Francis yesterday, my ears really perked up when it was mentioned that the Pope started out as a chemist. Well, after a little bit of digging, it turns out that he graduated from an industrial secondary school in Argentina as a chemical technician, probably roughly equivalent to a college diploma in chemical technology here. So it turns out you can start out as a chemical technician and end up Pope. Imagine where a bachelor’s degree in chemistry could take you!

Seriously, you really should think about it. There are wonderful careers to be had in chemistry. An article in Canadian Business last year ranked chemistry 5th among professions in terms of demand and recent salary growth. So you may not end up being Pope (or Chancellor of Germany—Angela Merkel has a doctorate in quantum chemistry), but you ought to be able to make a very good living as a chemist.